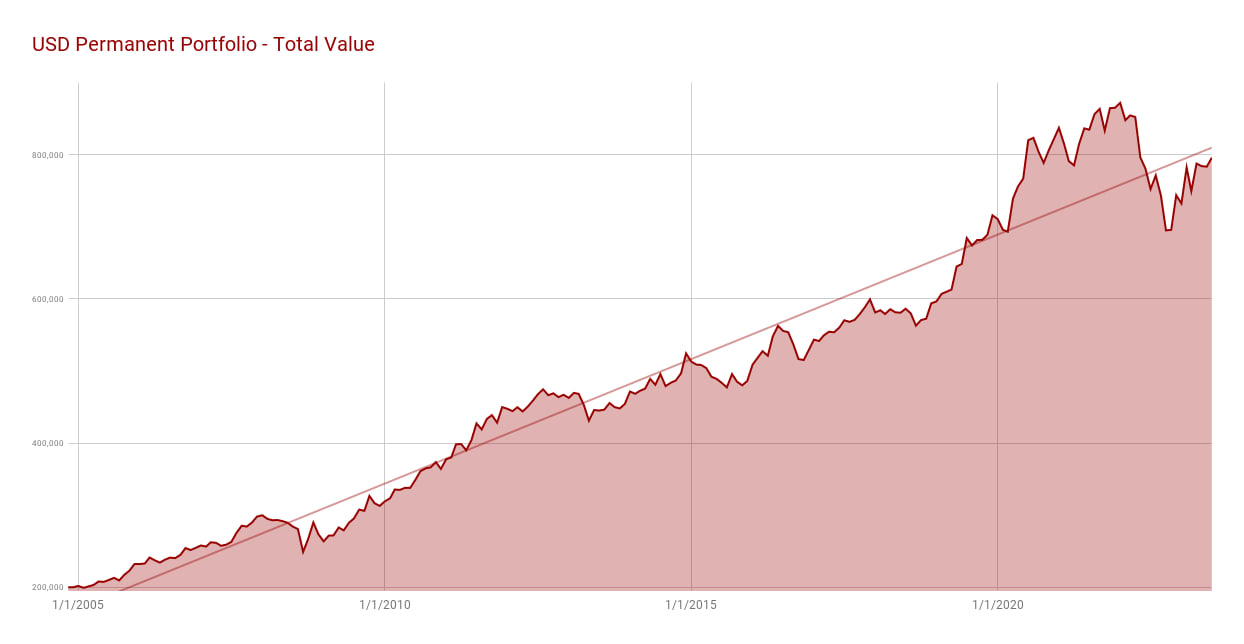
Below are the results of my personal USD Permanent Portfolio of mixed assets in US Dollar currency which is tracked in real time here on my website.
This portfolio was initiated to show the returns, in real time, along with the GBP Permanent Portfolio, the EURO Permanent Portfolio and the Peer to Peer Lender Portfolio, giving all portfolios similar balances so we can see the actual returns of each on a monthly basis.
I have personally been investing in these assets, with this exact asset allocation, for over 20 years.
** Please Note: VTI, TLT & GLD are USA domiciled ETF’s which cannot be purchased by residents of the EU (I purchased them before EU residents were banned from purchasing them). Good replacements which should produce very similar results, but are domiciled in the EU (still USD currency) are iShares Core S&P 500 ETF (USD) or the Vanguard S&P 500 UCITS ETF – VUSA (GBO/EUR) for stocks & iShares USD Treasury Bond 20+yr ETF (USD) for bonds. These are a good replacements you can purchase if you are EU based. Buying physical gold is always best if you can.
Return percentages below are not inflation adjusted. Previously the returns were displayed as inflation adjusted but I am no longer able to pull figures on inflation automatically.
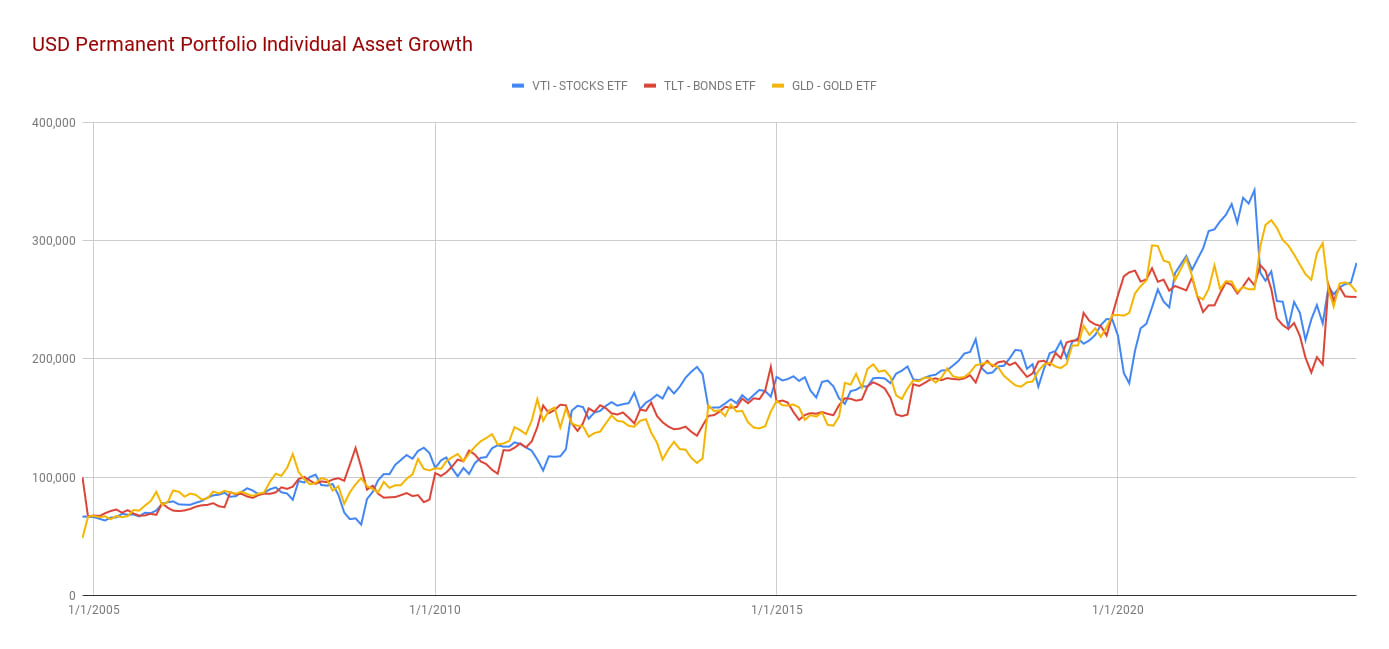
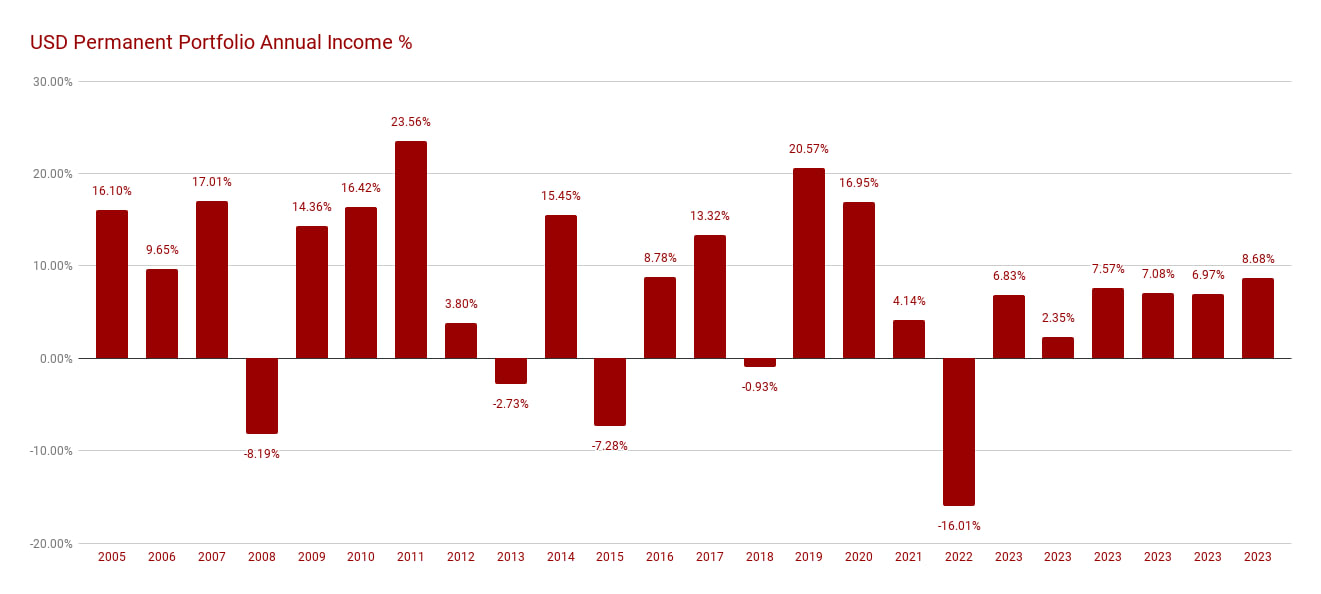
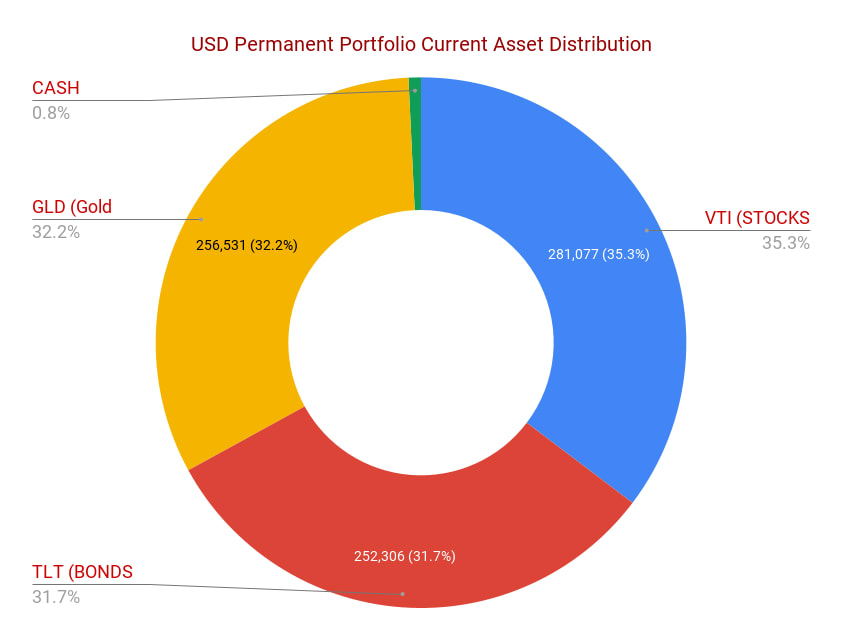
USD Permanent Portfolio Returns
(Click Image for Interactive Charts)
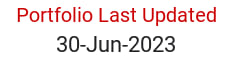
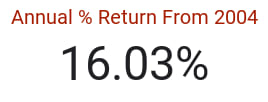
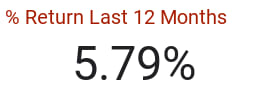
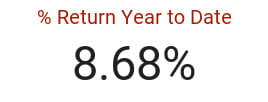
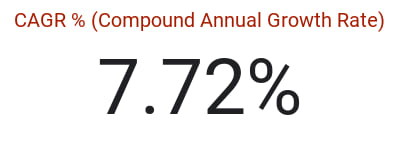
Dividend Reinvestment Included in Calculations
Below is a comparison of how a data model of my $ – USD Growth Portfolio compares to other popular portfolios over the last few years. As you can see, the % returns and drawdowns are better than the original Harry Browne Permanent Portfolio.
Portfolio 1 is my current USD Growth Portfolio Allocation (US Stocks, US Bonds, Gold, US REITs).
Portfolio 2 is the original Harry Browne’s Permanent Portfolio mix: US Stocks, US Bonds, Gold . Cash has been left out, as I think that skews it to the downside unfairly. Here is also a link to my USD Permanent Portfolio which I track monthly here on my website.
Portfolio 3 is made up of a 50/50 mix of US Stocks & US Bonds using ETF’s.
The S&P ETF is there as a representation of the US Stock Market Baseline.
NOTE: The returns shown in this simulation are INFLATION ADJUSTED meaning they are returns after inflation. The returns shown in my portfolios are BEFORE inflation.

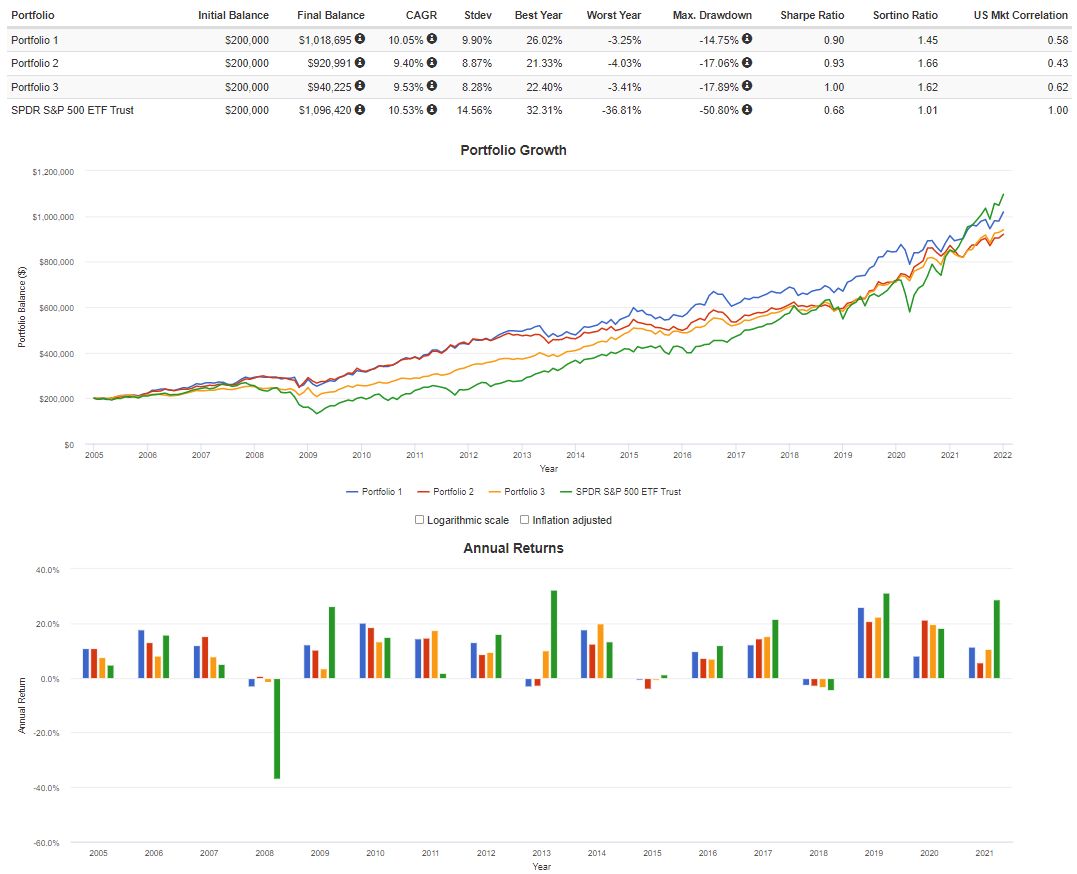
BALANCES shown are just there to show growth as an example. They are not actual portfolio values.
—
If you would like to read about backtesting, see my Backtesting page.
Disclaimer
This page is presented for informational purposes only. I am not a Financial Adviser and therefore not qualified to give financial advice. Please do your own research and make your own investment decisions. Read our disclaimer for further information.