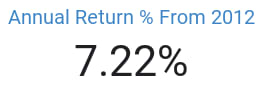
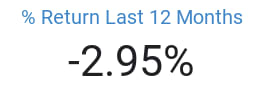
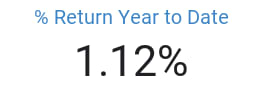
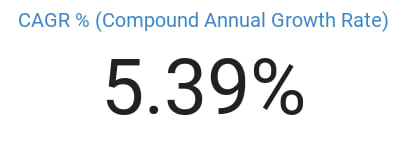
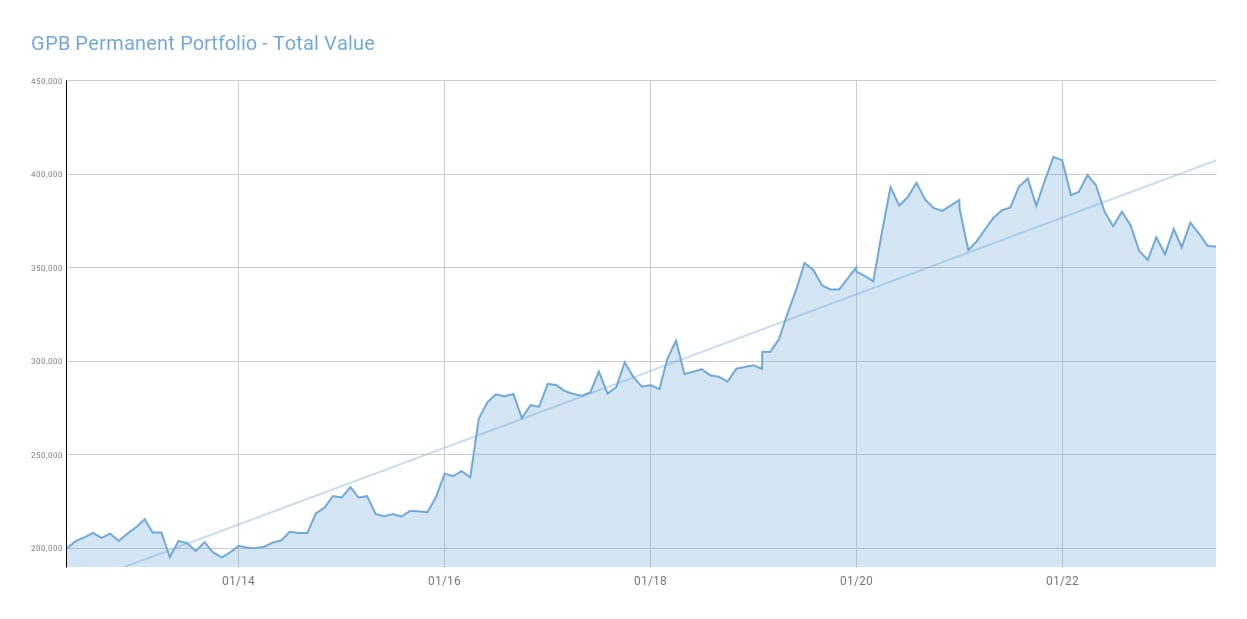
Below are the results of the British Pound based Permanent Portfolio which tracks World Stocks, UK Bonds & Gold in GBP currency-based funds which are traded on the London Stock Exchange. The portfolio is updated automatically from Google Sheets daily.
This portfolio is based on the well known Permanent Portfolio concept first introduced by Harry Browne back in the 1980’s, however the main cash component has been removed and invested in Peer to Peer lending instead of short term T-bills because for the last 10 years, they have paid very little return. The portfolio is re-balanced at the end of each year and that is really all the maintenance it needs.
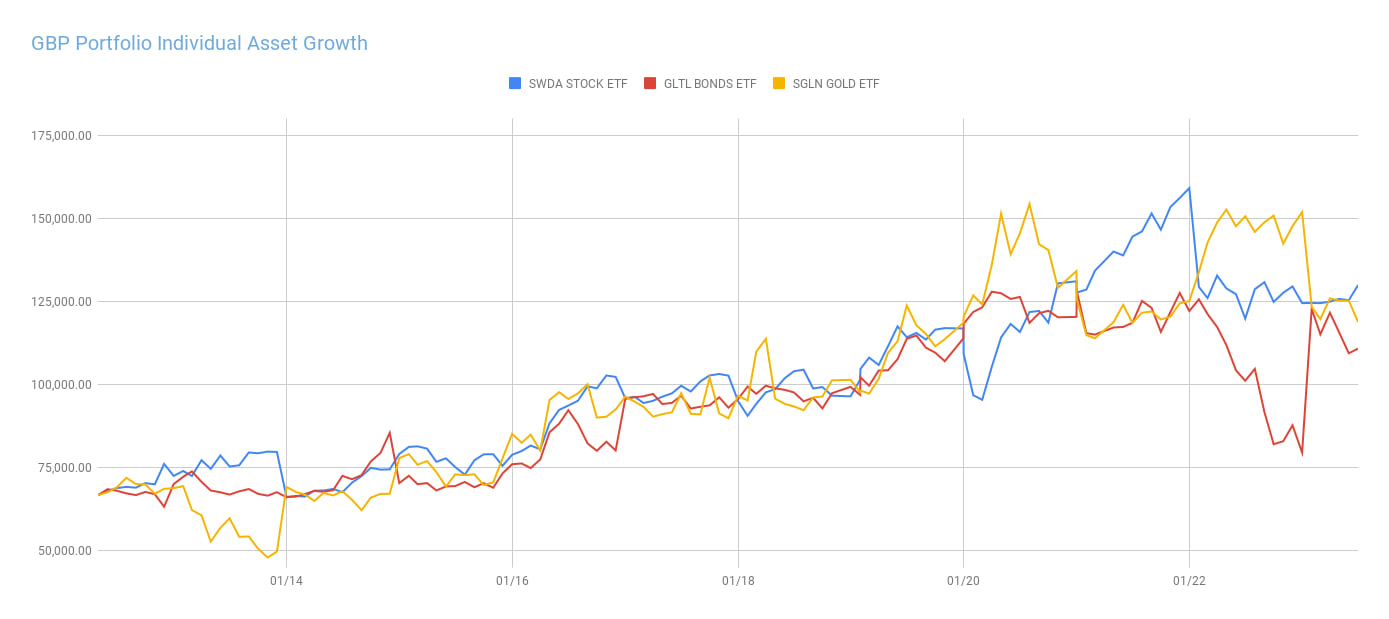
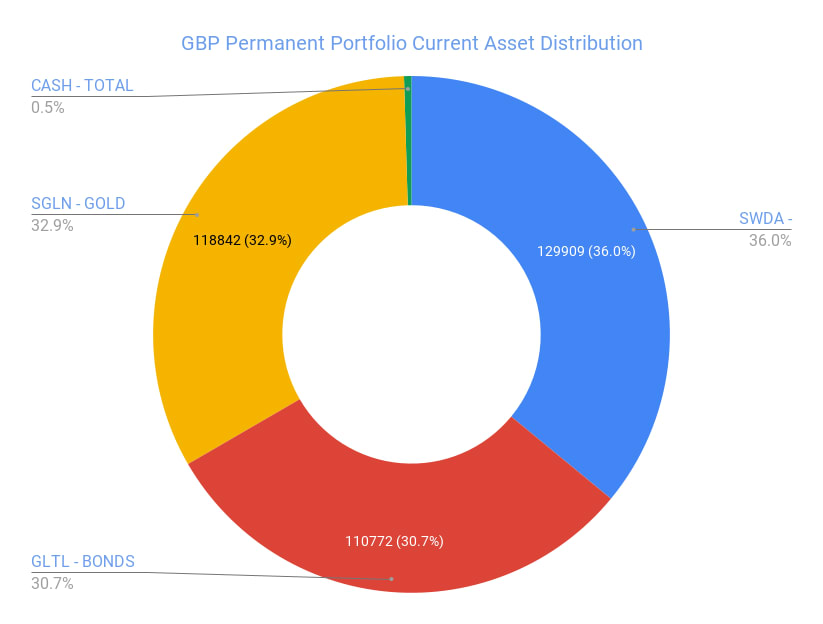
This portfolio uses the following ETF’s: CORE MSCI WORLD ETF (SWDA), Barclays 15 Year + GILT ETF (GLTL), and iShares Gold ETF (SGLN). Each fund is re-balanced to 1/3rd of the total portfolio value at the beginning of each year. Any of these funds could be replaced by other ETF’s or funds which track the same assets if required.
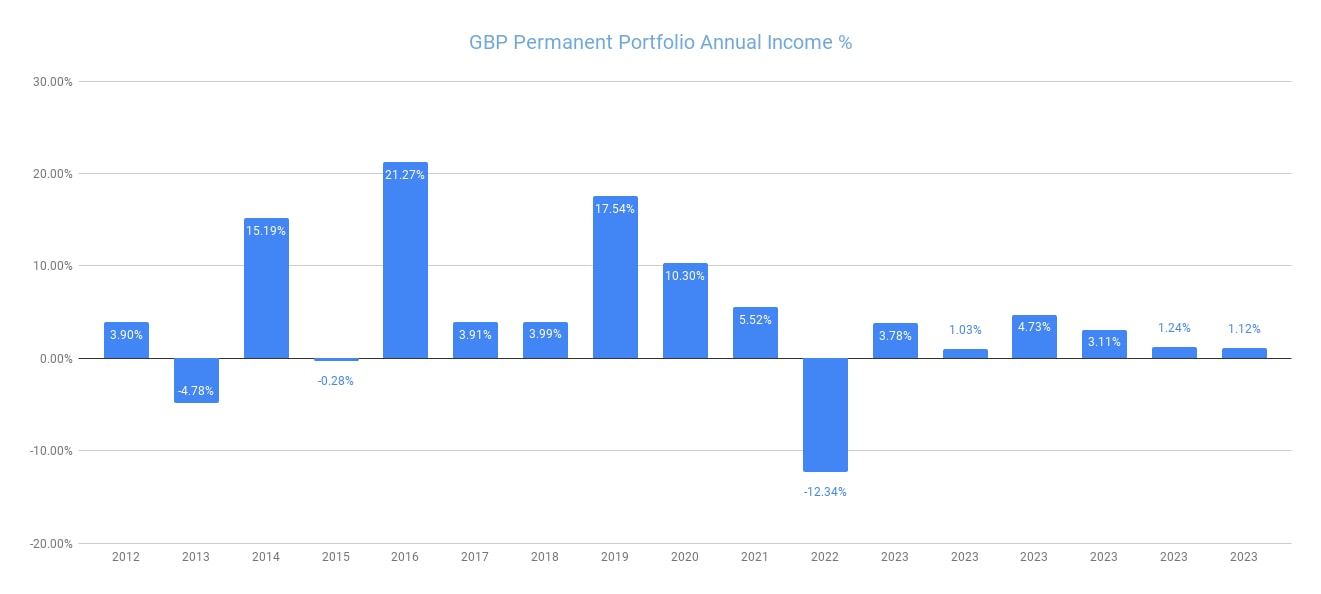
£ – GBP Portfolio Returns
(Click Image for Interactive Charts)

Dividend Reinvestment Included in Calculations
YOU CAN SEE THE ACTUAL SPREADSHEET DATA POINTS BY CLICKING HERE
Backtesting
This portfolio goes back to May 2012. I have not yet found a way to accurately backtest GBP fund or asset class data further back than that as I have with the US data based portfolios. Based on how similar the portfolio tracks the USD Permanent Portfolio, asset class performance should be similar to the USD based Permanent Portfolio in the long term, with adjustments for currency fluctuations of course. You can see that asset class test here at Portfolio Visulizer which goes back to 1978 and has returned an overall average of around 9.3% per annum for the last 40 yeas.
If you know of a way to backtest historical UK securities & bond data, please email me and let me know and I’ll be happy to add simulations to this page.
Disclaimer
This page is presented for informational purposes only. I am not a Financial Adviser and therefore not qualified to give financial advice. Please do your own research and make your own investment decisions. Read our disclaimer for further information.