Short term stock portfolio for The Obvious Investor website.
UPDATE: May 31st, 2021: The Recovery Portfolio was closed out at the end of May, 2021 for a profit of just over 27% in 5 months. I decided to take profit when the portfolio got back to the previous high which was the target of the investment from the start back in January, 2021.
This portfolio was intended to catch the move from the pullback caused by the COVID crash & ensuing recovery. I did exactly as expected. The portfolio only had exposure to Stocks & REITs (no bonds or gold) so it would be too volatile to hold as an ongoing concern.
I’m happy with the results 🙂

Historical Information on this Portfolio.
The Recovery Portfolio is built from distressed stocks & funds that have yet to recover fully from the COVID pandemic. It is made up of assets purchased on the US market in USD as I believe the US markets have the best chance of recovering faster considering all of the money the Fed has pumped in to them. Note my understanding is that all of the following stocks & funds can be purchased by UK & European residents as the funds are REITs, not ETF’s.
All of the assets in this portfolio were purchased January 7th, 2021, with a strategy of buying these stocks based on Real Estate, Oil Companies, and Value Stocks.
You can read more about how & why the portfolio was constructed in the blog post New Investment Portfolio – Best Stocks to Buy Now for 2021 with 50%+ Profit Potential
In short, the portfolio contains the following assets:
Commercial Real Estate

Oil – The Black Gold

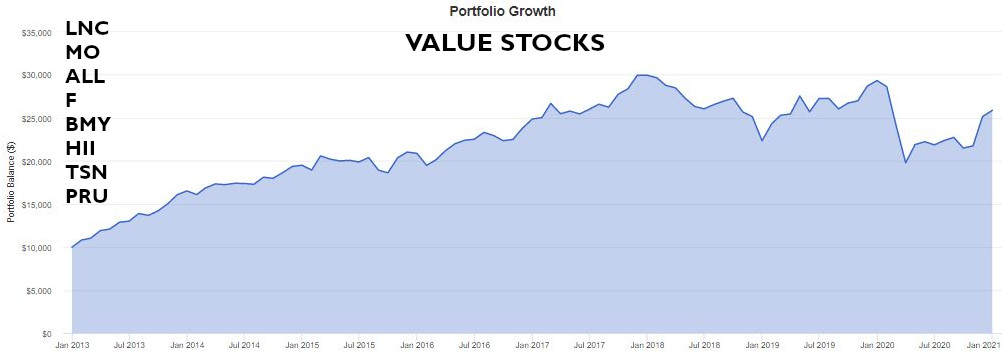
Value Stocks
Backtesting
Below is a backtest of the Recovery Portfolio in Portfolio Visualizer to see how a portfolio of these new assets would have faired in the past. It doesn’t look bad at all. As you can see below, From Jan 2013 (the earliest I could test because of Phillips66 history) to the beginning of January 2021, it had a annual return (CGAR) of 8.77% which is right on par with my other portfolios (just as a side note, if you test only up to the end of 2019, before the pandemic, the CAGR was 13.87% for the proceeding years 6).
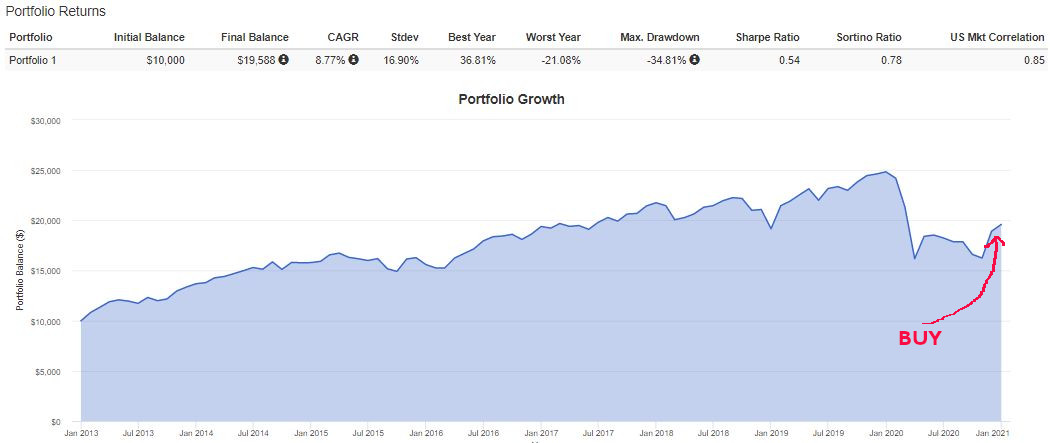

Click here If you would like to see this backtest in Portfolio Visualizer for yourself
Tracking Portfolio Returns
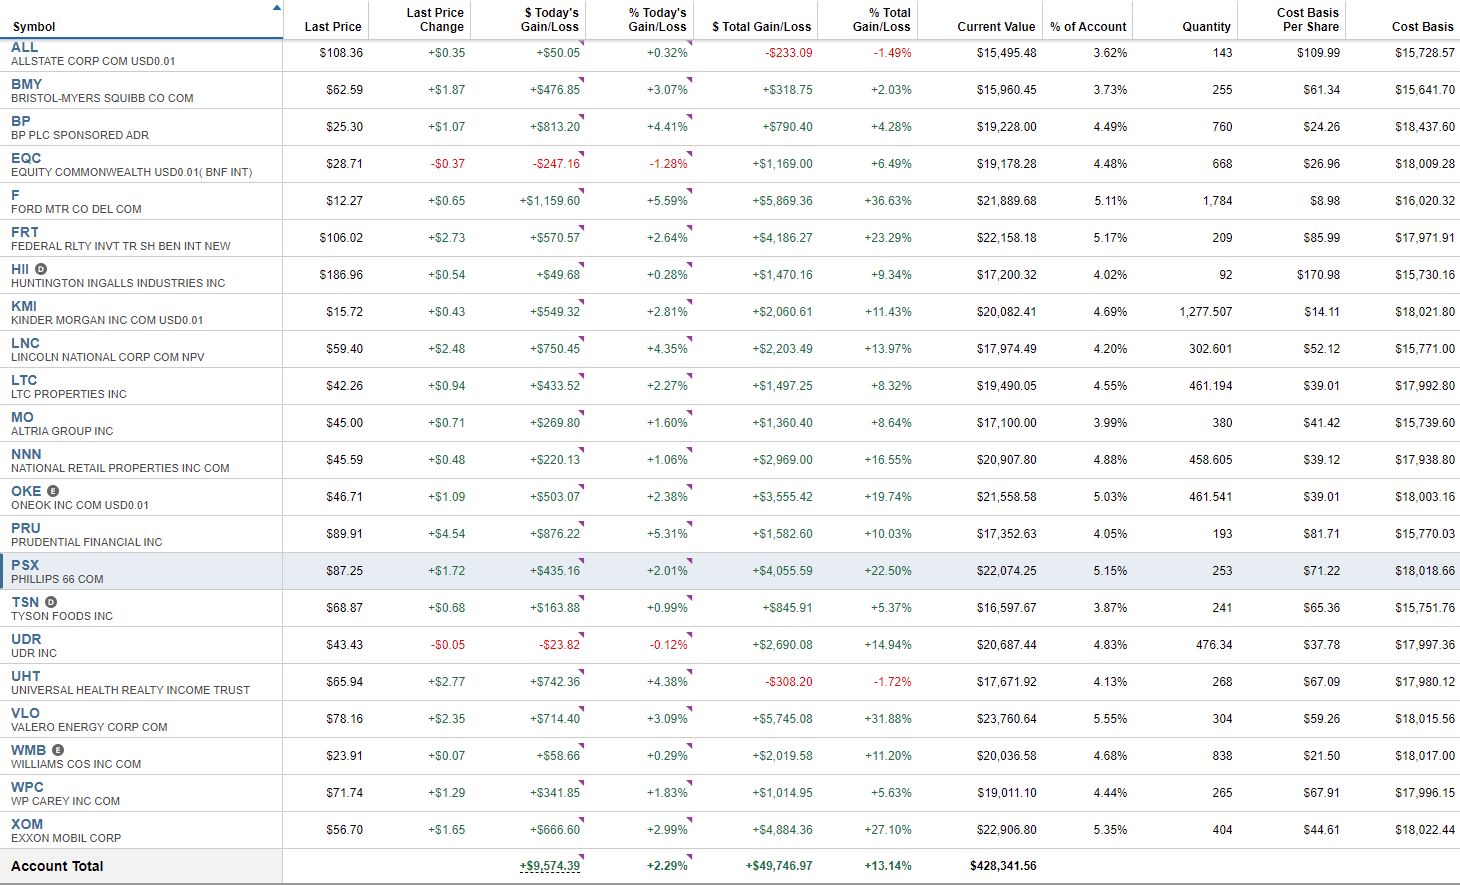
I initiated this new portfolio (bought all assets) on January 7th, 2021. As it’s still so new, there is not yet enough data to create Google charts to display like the other portfolios. So for now, I’ll just insert a screen shot of the portfolio from my brokerage so you can see on there how it’s doing. Once we get a few months of data, I’ll start the same portfolio tracking as I do for the other portfolios.
Click on the image to see it full size
You can read more about how & why the portfolio was constructed in the blog post New Investment Portfolio – Best Stocks to Buy Now for 2021 with 50%+ Profit Potential
Disclaimer
This page is presented for informational purposes only. I am not a Financial Adviser and therefore not qualified to give financial advice. Please do your own research and make your own investment decisions. As I buy & sell assets, & rebalance portfolios often, not all investment data can be deemed as accurate all of the time. Some of it is used for tracking purposes only and quote & position data is imported from quote services & portfolios that we cannot guarantee the accuracy of. Read our full disclaimer for further information.

€ – Euro Permanent Portfolio

£ – GBP Peer to Peer Lending Portfolio

Maturing Whisky Portfolio

$ – US Dollar Permanent Portfolio
Below are the results of my personal USD Permanent Portfolio of mixed assets in US…

$ – US Dollar Growth Portfolio

฿ – Cryptocurrency Portfolio
