Return figures for September 2018.
The Growth Portfolio pulled back a little in August. The markets still have a bit of confusion about the trade wars it seems, plus all this posturing going on in the U.S. about Trump and his team, so things were a little mixed. Pullbacks & drawdowns happen frequently with this type of portfolio, so it is to be expected. Over all our asset allocation is still doing well.

Each individual asset is still in the same range it was last month. Gold being the worst of them. As you can read here about gold, we have a love/hate relationship. No dividends and very volatile, but when it matters, it’s there to prop up the rest of the portfolio.

Dividends
We had dividend payments in September as follows:
TLT 0.272334 per share x 415 shares = 113.02
FRT 1.02 per share x 141 shares = 143.82
UHT 0.67 per share x 269 shares = 180.23
So now we can see the cash account growing a bit. When I rebalance the portfolio at the beginning of next year, I’ll purchase shares of whatever asset is required to balance out the portfolio.
Rebalancing
Rebalancing is how profit is taken from a portfolio such as our Growth Portfolio. Whichever assets have performed the best have parts sold and the capital added to assets that have not done so well. Sticking to this strategy helps us to buy low and sell high. It’s not an exact science of course, but over the years it has worked well.
At the beginning of each year we should rebalance assets to the percentages they started at: 25% Stocks, 25% Bonds, 25% Gold and 25% REITs.
Portfolio Comparison Simulation
Here is a comparison of our Growth Portfolio compared to Harry Browne’s Permanent Portfolio. I did the simulation back from 2017 to September 30th 2018 as it shows better. As soon as we get enough data from our real portfolio I’ll simulate the comparisons just on that data, but for now this serves. Obviously this is just a simulation and only has relation to our portfolio in growth percentages on the individual assets. You can see a longer term simulation (almost 20 years) here.
Portfolio 1 is our Personal Growth Portfolio
Portfolio 2 is the Permanent Portfolio Assets

As you can see, dropping the cash and adding REITs increased the profit of the portfolio in 2017 and also limited the drawdown seen thus far in 2018.
REITs
REITs make the difference between my Growth Portfolio and the Permanent Portfolio. I like them for lots of reasons. Their high dividends is one of them. Compare them to a standard stock or bond ETF and they pay almost double! That’s because in order for a REIT to operate they have to give out most of their profits in dividends.
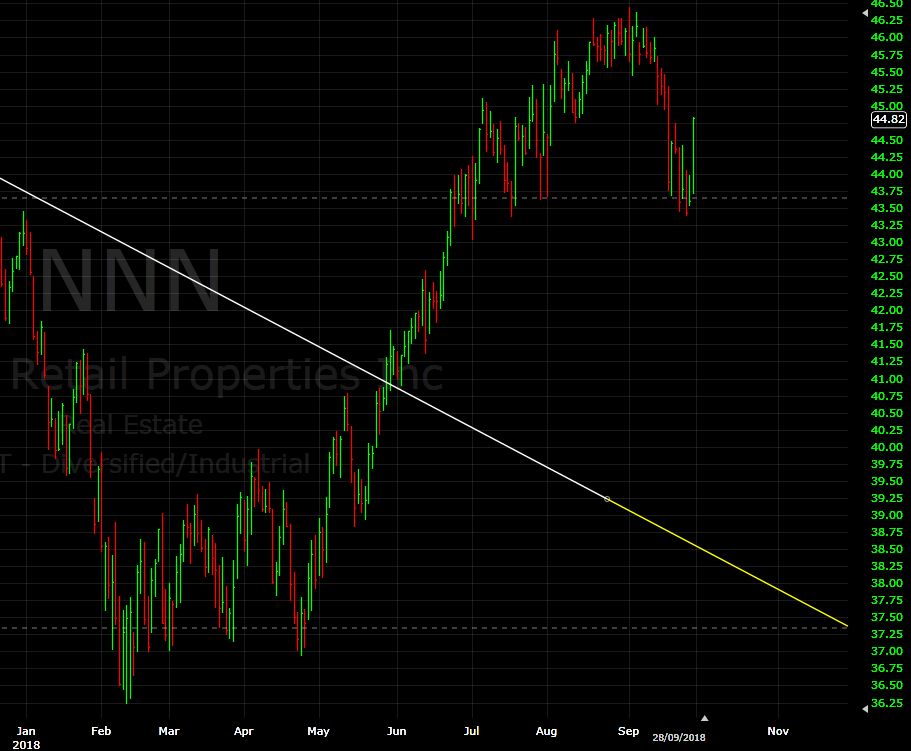
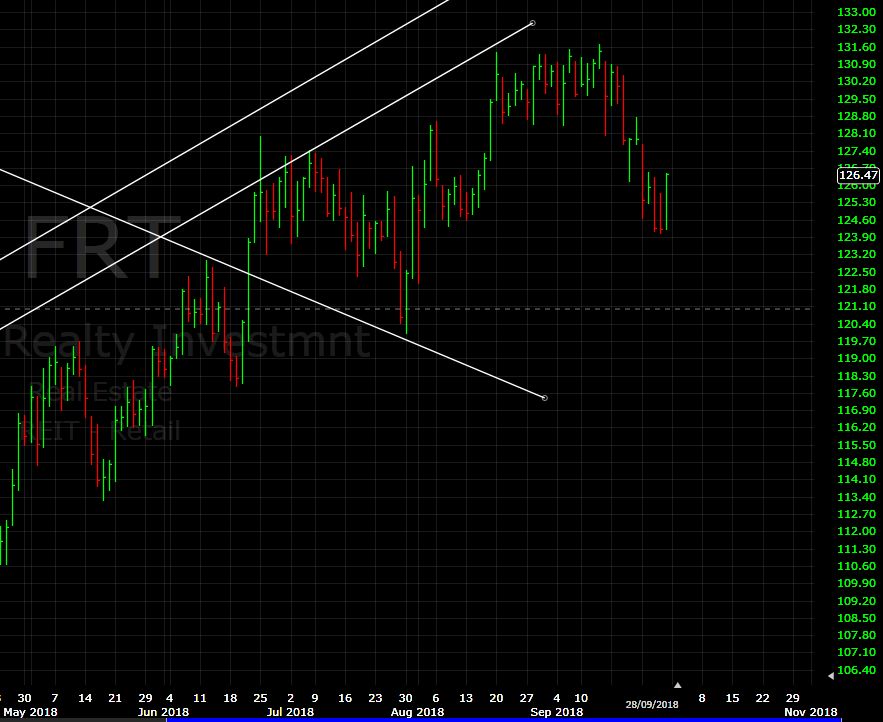
All three of the REIT’s in our Growth Portfolio pulled back a little in September after a great run in August.


I found it interesting that on the very last trading day of the month (and the quarter), all of the REITs made a significant jump back to the upside. Let’s see if they can continue that run for October and beyond.
Gold, Bonds
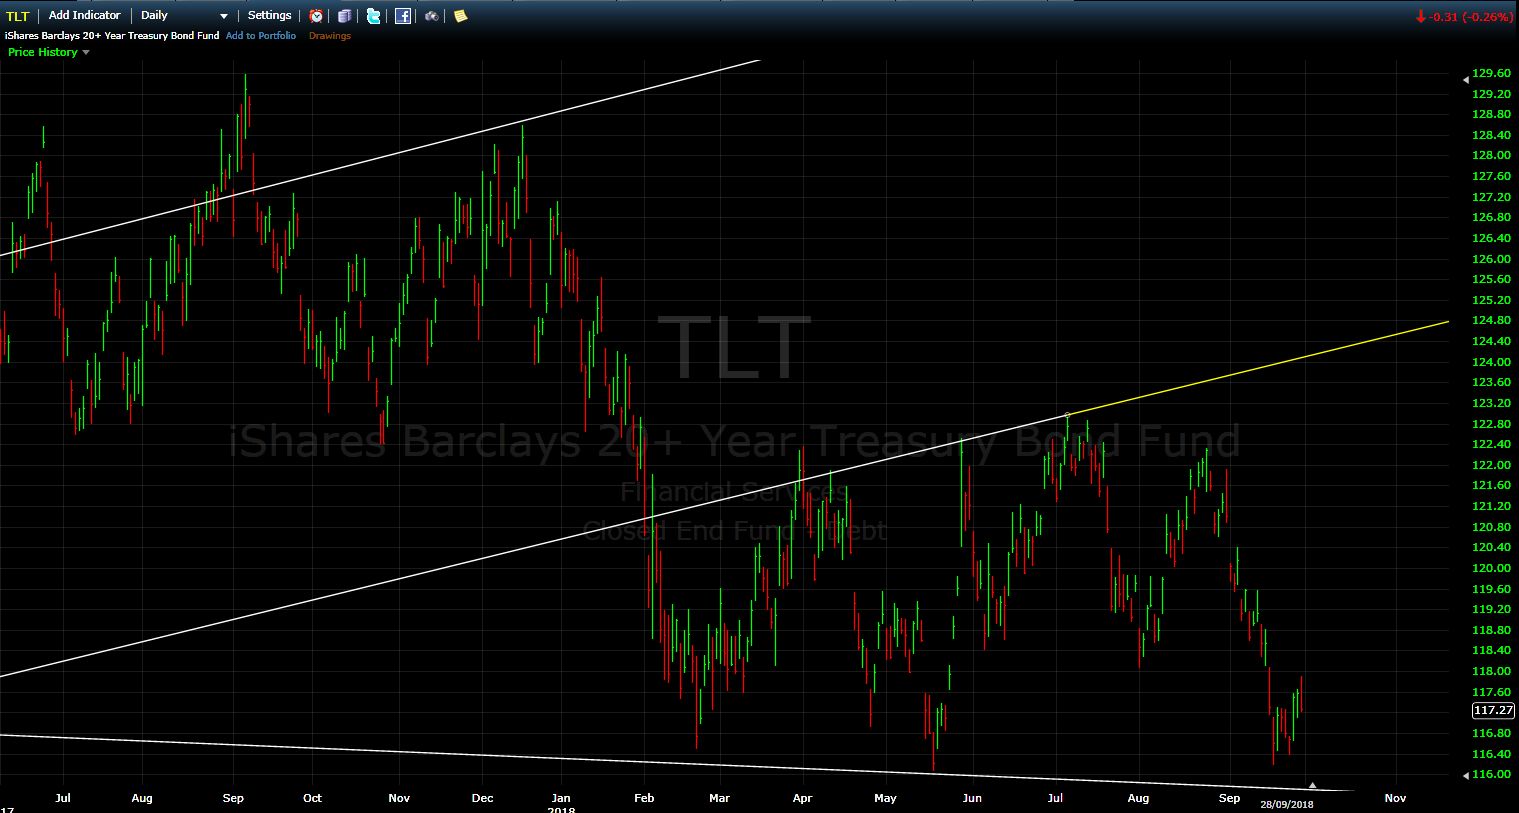
The other assets in our portfolio except for stocks (which are still on the longest bull run in history) are at intermediate lows. Remember last month Bonds (TLT) took a dip after a good run. And carried on to the next support level. It will be interesting to see if it breaks to the upside again. It seems to be in a consolidation pattern since March.

Gold (GLD) on a daily chart has taken a down-leg since April and stopped at the next resistance level.

However if we look on a weekly chart, we can see that GLD has also been in a big consolidation since 2013.

I wonder if it’s getting ready to break. Personally I think it is due for a run up, but who knows how long it can take to do it?
Looking at Charts
Looking at charts is something that I’ve done for many years, and I quite enjoy it. However it never changes my strategy on the Growth Portfolio of “hold, rebalance, hold”. I know through many years of investing and backtesting that this strategy with these assets has worked for many years, and will continue to work. As soon as I stray from that, I know from personal experience that I’ll get bitten. An old trader I used to know told me “plan the trade, then trade the plan, never stray”.
Next update will be for the Peer to Peer Lender Portfolio. I should have the figures together soon.


