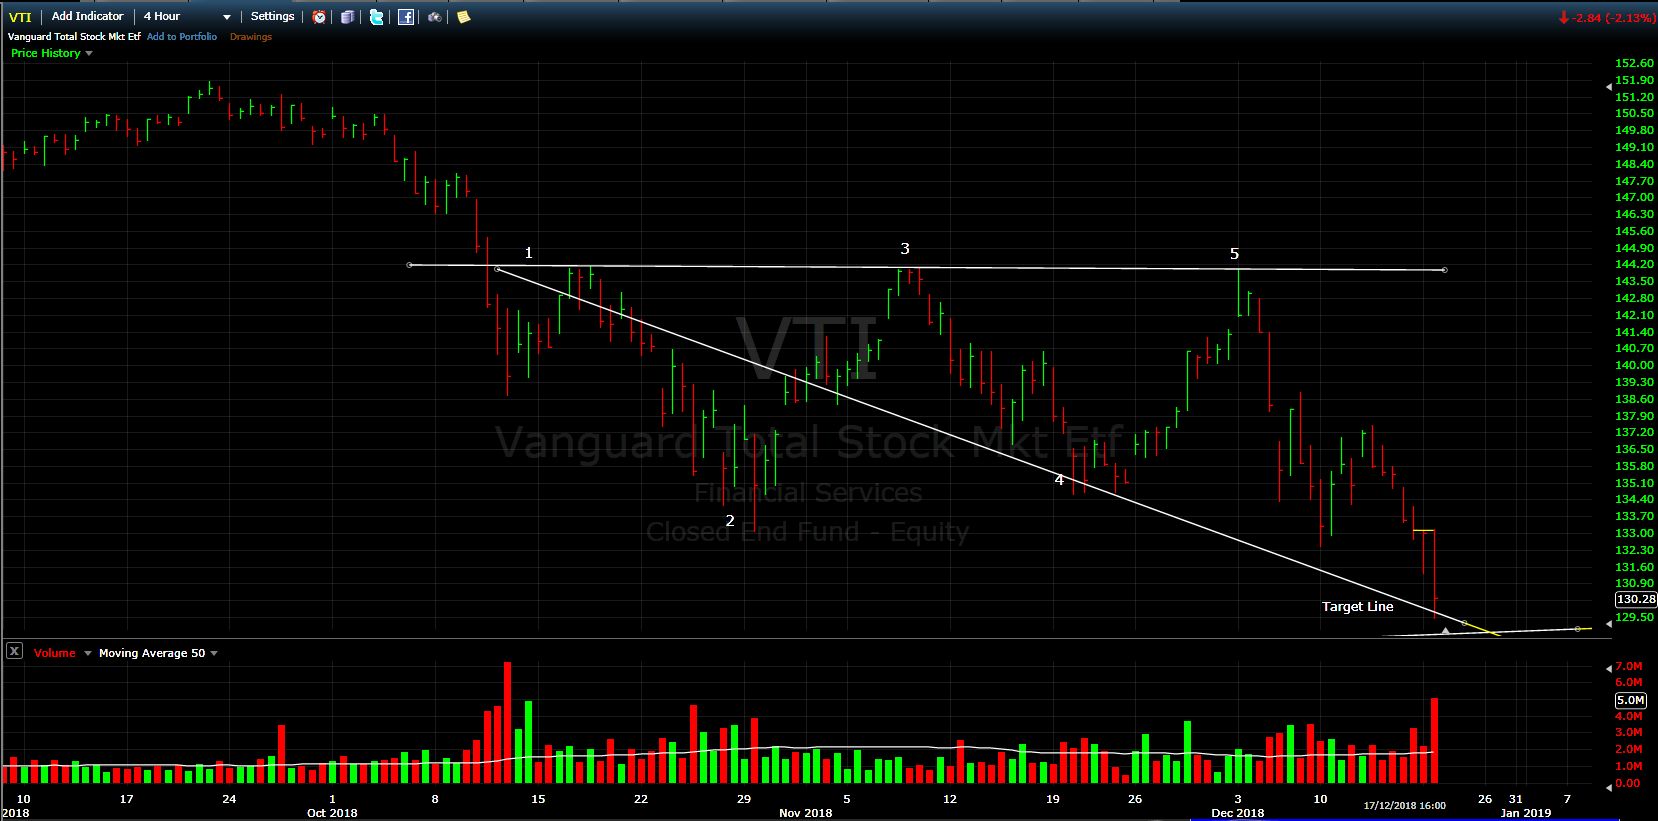
On the 9th of December I posted about a potential bearish wave in the S&P 500 & VTI ETF. Yesterday (17-12-18) it hit the target line exactly in Both!
Here is the wave in the 4 hour time-frame on the VTI ETF.

If we would have taken a short position at the number 5 point (around 143.50), the target line is where we would have exited the position (at around 129.50) for a profit of about 14 points (USD in this case) per share in less than 15 days!
EUR/USD Bullish Wave
I have been studying Wolfe Waves more and more over the last couple of weeks. It seems they are just about everywhere if you know where to look and know the rules of how waves are constructed. I can’t publish all of the rules here but if you go to Bill Wolfe’s website you can learn more if you’re interested.
Below is a bullish wave in the 60 minute Euro/US Dollar currency pair that I have been watching for about a week now which hit the target just now (18-12-2018 @ 11:15am GMT) as I am writing this post.

The more I look for the waves, the more I see them.
Bullish Wave in Bond ETF
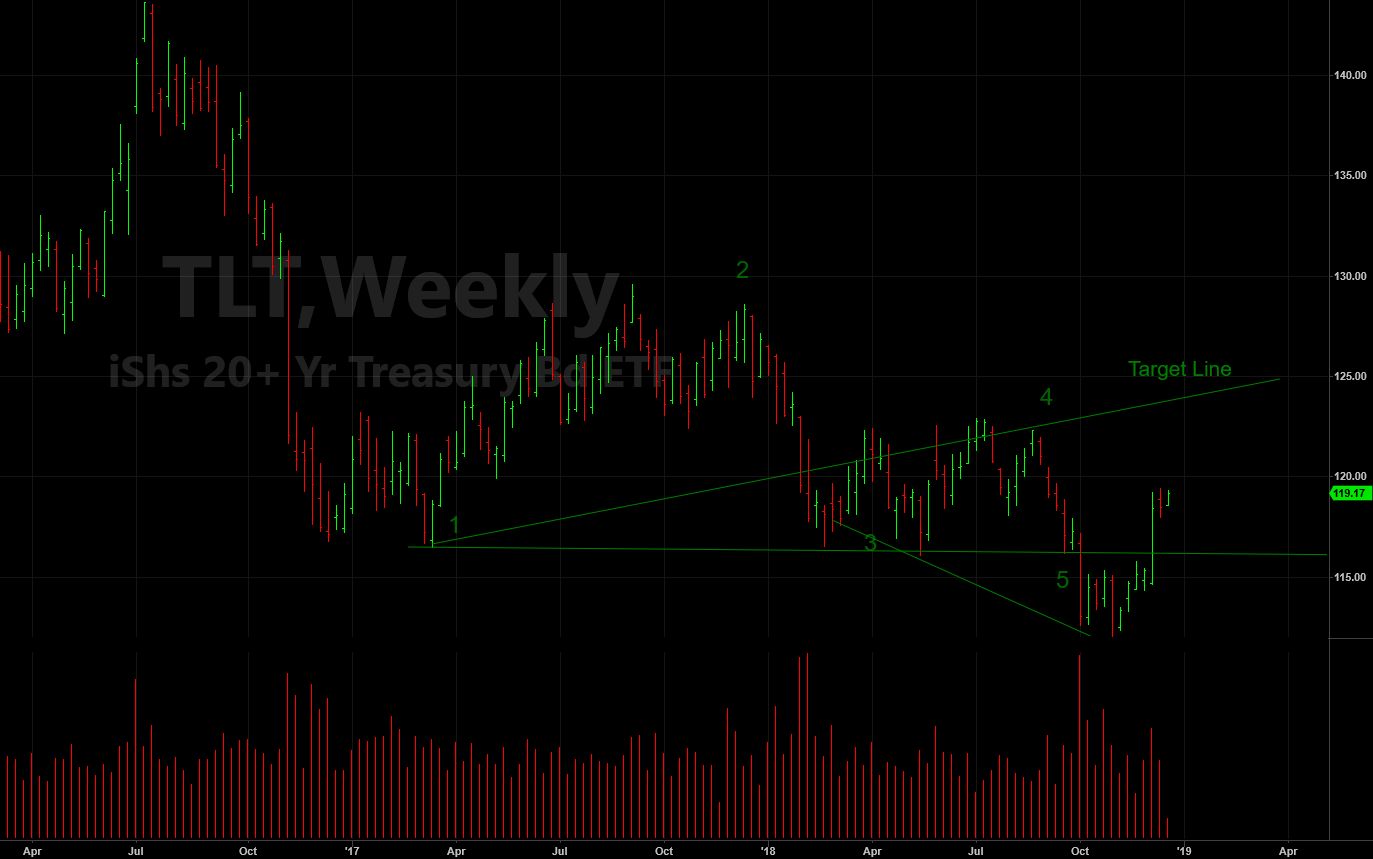
Here is a bullish wave in the weekly time-frame TLT ETF (US long term treasury bond ETF). This would have been a buy around the 1st week of October. It is already half way to its target. Although this is not a perfect wave formation, it would already be good for 5-7 points of profit.

Using Options to Profit from Wolfe Waves
Something I have been looking into is using options to trade these wave as per Bill Wolfe’s website. There are some HUGE profits to be made if you know how to identify waves correctly and then use options on to trade them. Options limit the risk potential and expand the profit potential exponentially. Wolfe Waves not only provide a price target, but they also give a fairly accurate idea of when that price will be reached when you know how to construct them correctly. If we know this information, we can purchase put or call options, taking advantage of their time decay and a strike price that puts us in the money somewhere before the target line.
Bullish Wave in the SPY ETF (S&P 500 tracker ETF)
In the post from December 9th, I also identified a contrary bullish wave which seemed to be forming in the 60 minute SPY. Although this wave is in a different time-frame, it seems to be an almost perfect wave, formed very nicely meeting almost all of the rules.

Summary
Not every wave will react, or meet the target line, however the better the wave formation, and how many of the rules it meets, increases the chances of it meeting the target line. It will be interesting to see how this wave in the SPY goes. Will it turn around and head up at the 5 point? Or blow through it and continue down. The news is all bearish at the moment so it will be going against the consensus if it does.
I’ll continue to look for Wolfe Waves in the various assets I follow. If you see anything that you might like to share, or if you have questions or comments, please feel free to contact me as I am always eager to watch and discuss these waves and learn more about them.
Please read my disclaimer before making investment decisions. These posts on Wolfe Waves are for example and discussion purposes only and should not be taken as investment advice.


