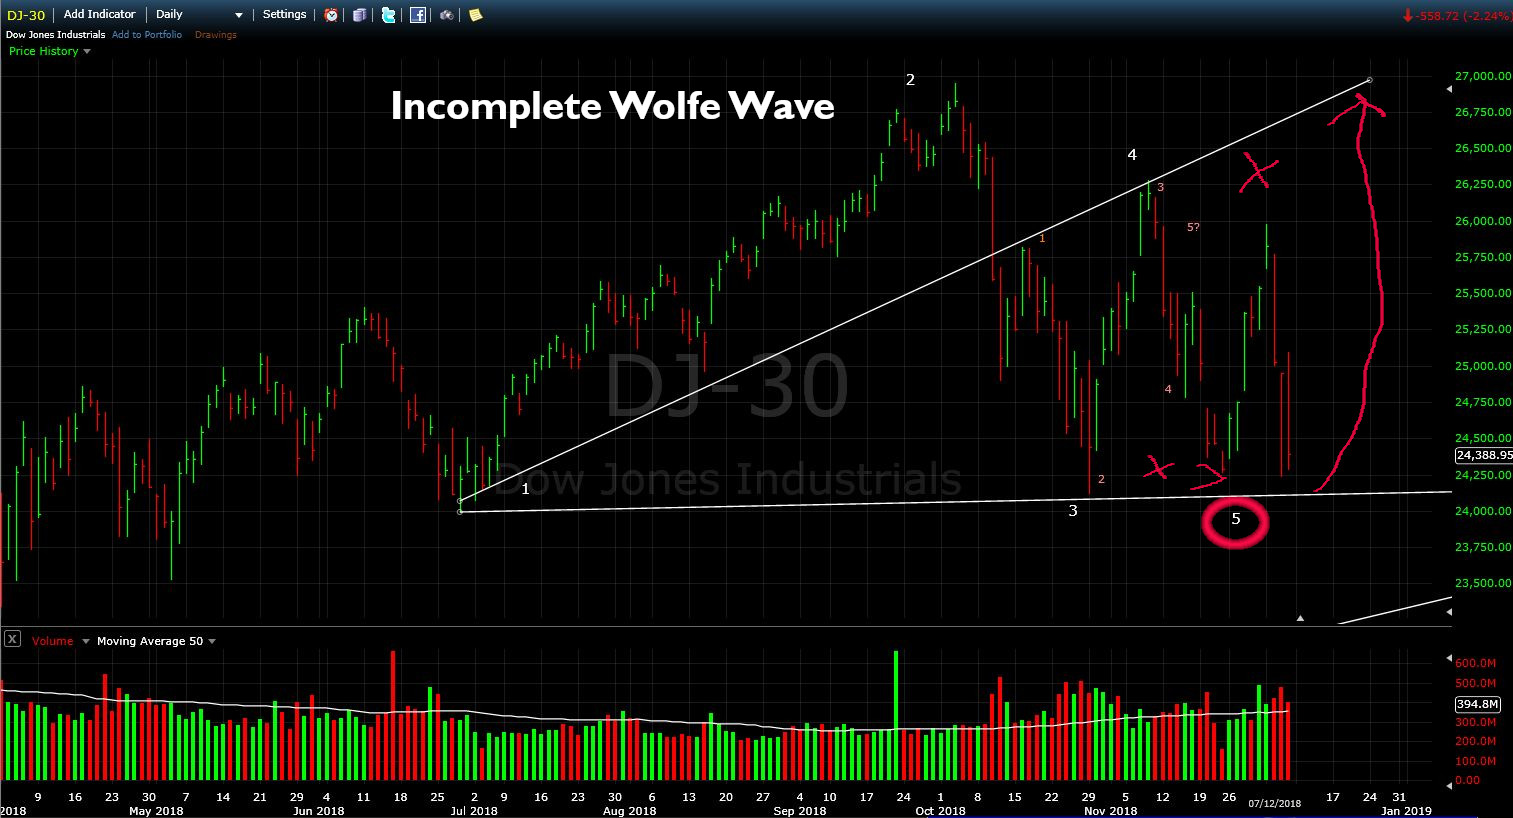
Last month I wrote a post about a possible bullish Wolfe Wave appearing in the Dow Jones 30. As you can see in the illustration below, price didn’t reach the 5th point entry area of the wave, it took off early. It still looked to me like it might hit the target line, but it stalled before the resistance at point 4 and turned back down.

Bill Wolfe
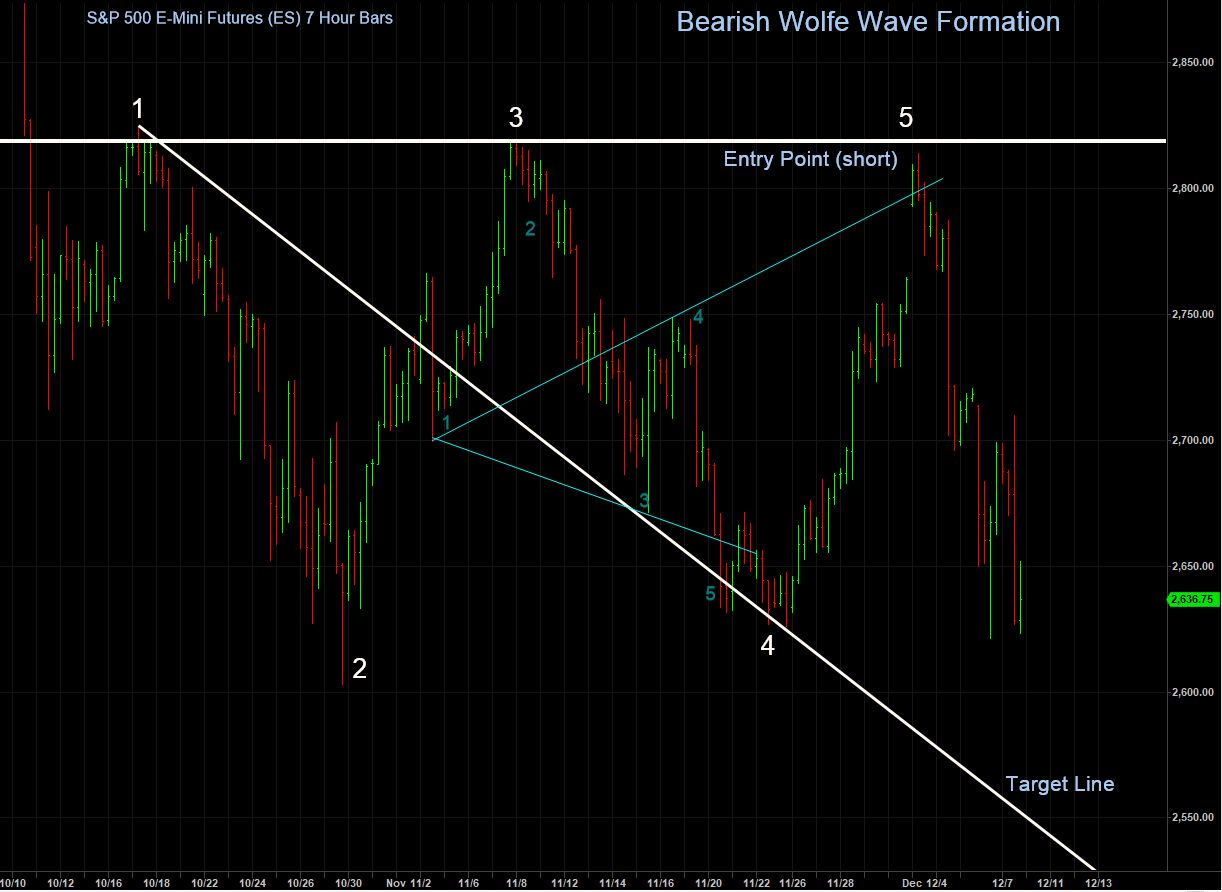
So, I thought perhaps I was imagining the wave and it was just a coincidence. It’s been a long time (almost 20 years) since I had any instruction on how to identify Wolfe Waves, so I decided to write to Bill Wolfe and ask his opinion on the off-chance he might take pity on me and tell me where I was going wrong in my interpretation of the wave. To my amazement Bill replied quickly and suggested that I was on the right track with the wave, however because there are only 30 companies that make up the Dow Industrials, it is not the best representation of the market so the waves have a tendency to be less clear. He sent me the chart below of the S&P 500 (futures in this case) where you can see the wave much clearer. Bill has been trading Wolfe Waves for around 30 years, and as he also invented them, so I guess he knows what he’s doing 🙂
We can see on Bill’s chart (this is a 4 hour bar chart), that not only did the wave reach point 5 (the entry point), but it also took off and hit the target line exactly before turning down!
It amazes me just how accurate these waves can be when you know how to identify them correctly. There is a lot more to identifying a Wolfe Wave than the points shown on this chart of course. Head over to Bills’ website www.wolfewave.com for more information on how to identify a Wave.
Bearish Wave in S&P 500
After receiving Bill Wolfe’s reply to my questions on the bullish wave in the Dow, I switched to looking at the S&P 500 futures contract, as well as the VTI ETF that I invest in with my Growth Portfolio. Looking at the charts from a different perspective, I noticed now a bearish Wolfe Wave that looked like it was about to reach point 5. I continued to watch, and sure enough it set off headed to the target line. You’ll notice in the chart below that the wave in Bills chart is the smaller bullish wave marked in smaller numbers. As soon as that bullish wave completed, it became part of a larger bearish wave.

You can see on the above chart that this is “almost” a perfect wave, except that it didn’t quite make it to the entry point at wave 5 (again). But it was close! It meets a lot of the other Wolfe Wave criteria too but I can’t disclose that publicly here as it would be giving away Bills’ methodology which is protected. Again you can read more about it on Bills’ website if you’re interested in Wolfe Waves www.wolfewave.com.
VTI – Same Wave
I also took a look at VTI and the 5th wave actually did make it to the short entry point here (these are 4 hour bars), so that makes the wave complete.

Contrary Wave
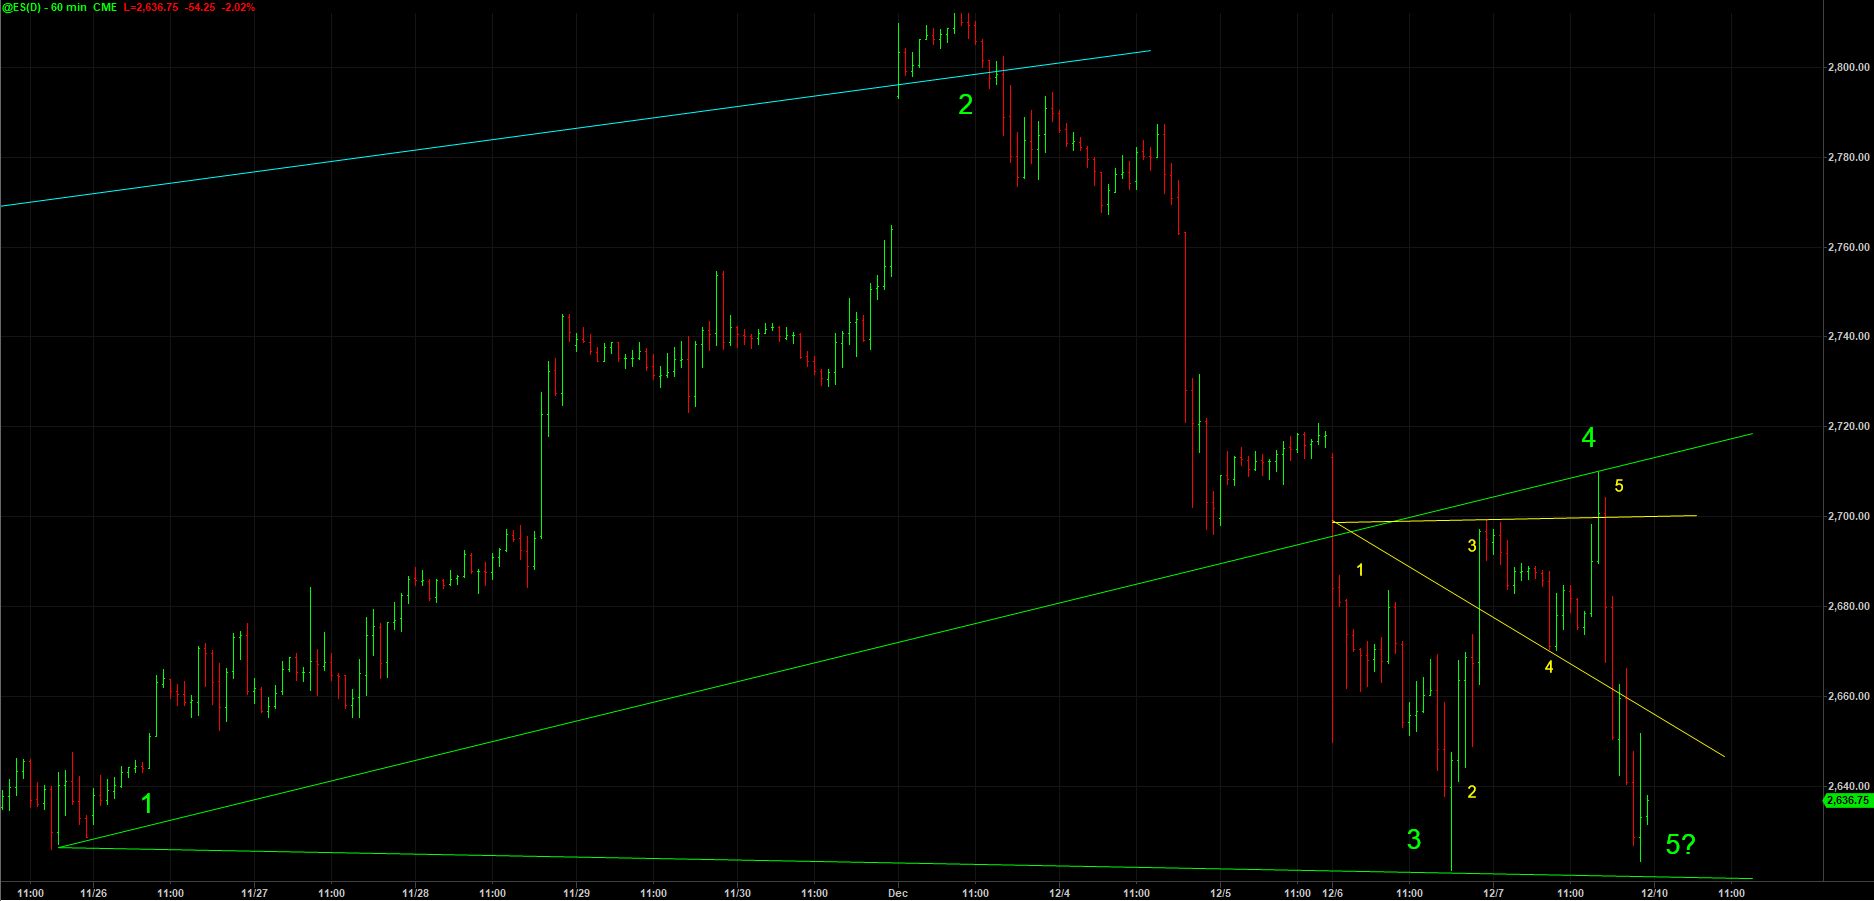
After beginning this post, I switched to a shorter time frame and noticed there is a contrary bullish wave forming in the 60 minute time frame that may reverse the 420 minute bearish wave. This smaller contrary wave could prevent the larger bearish wave from reaching it’s target. That’s one thing you have to be aware of with Wolfe Waves, waves in the opposite direction can form any time so if you were trading a wave, and a contrary wave were to develop, you would want to get out and take any profit.
See the green numbers and lines in the 60 minute chart below showing the contrary wave? The smaller numbers in yellow are showing a wave within a wave which helps identify balance.

Summary
It will be interesting to watch to see if the larger time frame bearish Wolfe Wave hits the target line or not. Or if the 60 minute wave sends price back up the other way towards that target line. Wolfe Waves certainly don’t all complete like magic as there are lots of factors impacting the movement of the markets, and waves within waves as you see here. Personally for me, it’s fascinating how these waves move. Take a look at all of the charts above and notice how when the wave gets to the 5th point (entry point) price just takes off in the opposite direction. If I weren’t looking at the full wave, I would just write it off as “chop” in the market which is almost impossible to trade.
I have found a renewed interest in Wolfe Waves so I will be looking at them more closely moving forward. I’ll post back here on obviousinvestor.com when I find anything else of interest.

