Wolfe Waves
Many years ago when I was still finding my feet with investments and looking to “get rich quick”, I took an interesting trading course by a gentleman called Bill Wolfe on an investment strategy called “Wolfe Waves” (named after himself obviously). It is similar to the Elliott Wave Theory, however much easier to implement, or is supposed to be. It theorizes that markets move in waves, and if you can identify them, you can learn to trade them and make some big money.
Construction of Wolfe Waves
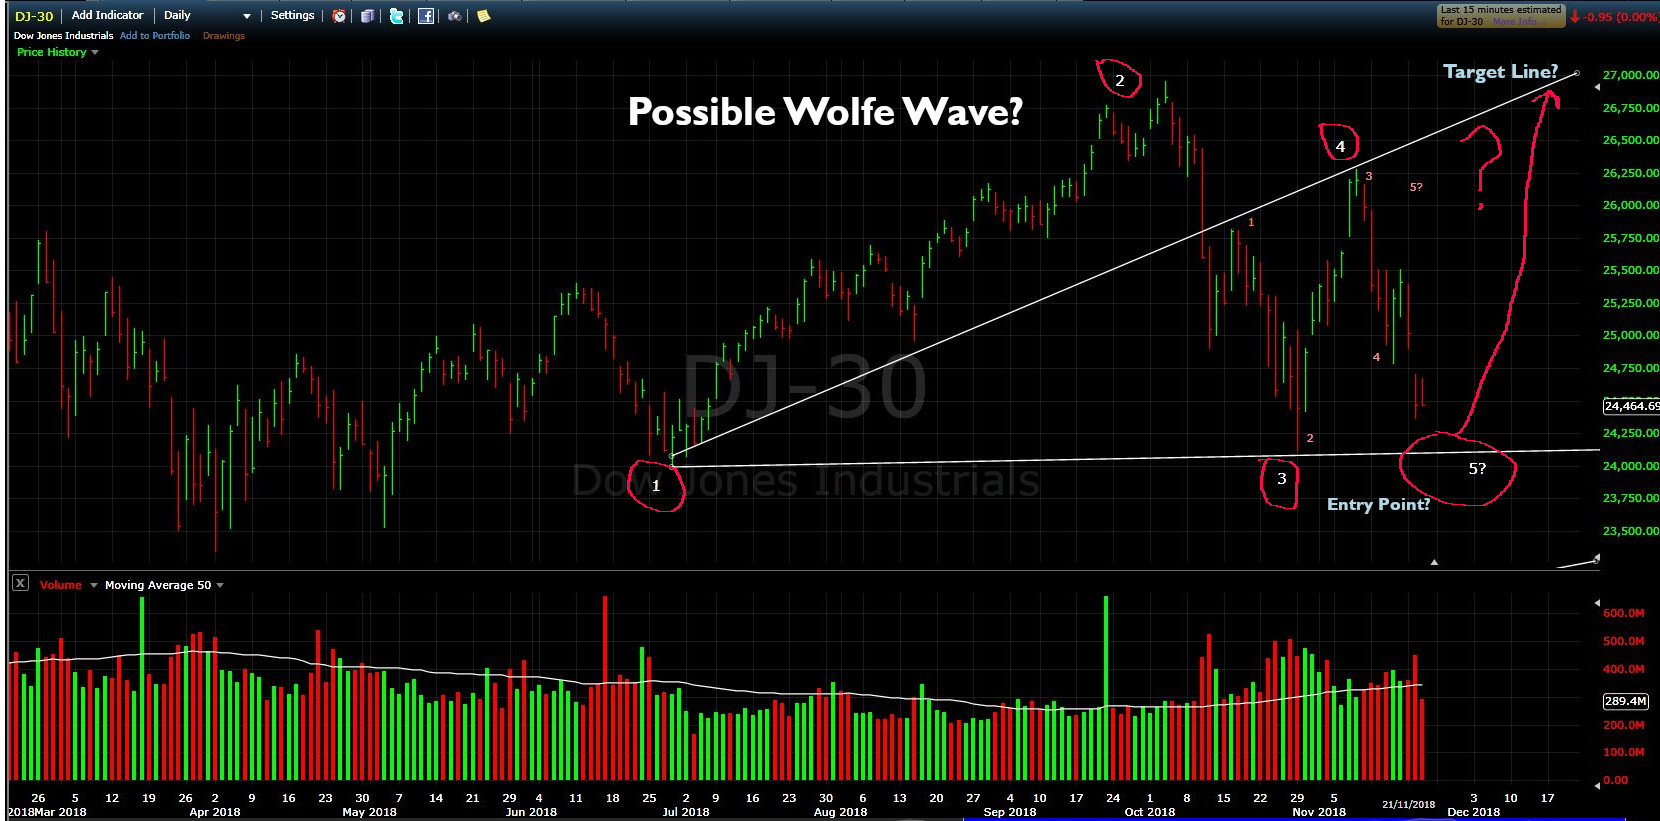
Wolfe Waves have 5 points. You start counting at wave number 2 which is a recent, isolated high or low, then you go back to the start of that high or low to find a number 1 point. The 3rd point is when the market pulls back to point number 1, then turns and heads back towards point number 2. The 4th point is when the market turns again back towards points 1 and 3 and then the 5th point is the entry point for the trade. You can see this better on the chart of the Dow Jones 30 further below. The trade is entered at point 5, and then a target line is drawn between points 1 and 4 and extended out to the right in to the future. The target price of the trade is this line. You can get more details about Wolfe Waves on Bill Wolfe’s Website.
Ever since I took the course, I am always aware of these Wolfe Waves when I’m looking at charts. They can be seen on pretty much any chart, in any time frame. Heavily traded markets seem to be more susceptible to Wolfe Waves as opposed to thinly traded markets. I have actually made a few successful trades following these waves, but that was many years ago. I made a few not so good trades too 🙄
If you follow my website you will know these days that I invest in my Growth Portfolio and Peer to Peer investments rather than trading short term strategies. Although I believe there is money to be made short term trading if you know what you’re doing, these days, I prefer to sit back and watch my capital grow as part of an overall long term investment strategy.
Wolfe Wave in the Dow Jones 30 Now?
I’ve been watching the Dow Jones Industrial Index lately with the pullback that’s occurring at the moment, and it struck me that there may be a Wolfe Wave appearing in the daily time-frame.
Take a look at the chart below and you’ll see that I’ve placed the points of the waves on this daily chart. There are many rules for Wolfe Waves, way too many to go into here (plus it would likely get me in to trouble giving away Bill Wolfe’s secret strategy), however one rule that helps to confirm a Wolfe Wave is a smaller counter-wave developing inside the main wave. You can see on the chart below I have placed smaller numbers for the counter-wave. However the counter-wave didn’t complete to the 5 point so this may be a sign that the Wolfe Wave is weak and may not complete.

Summary
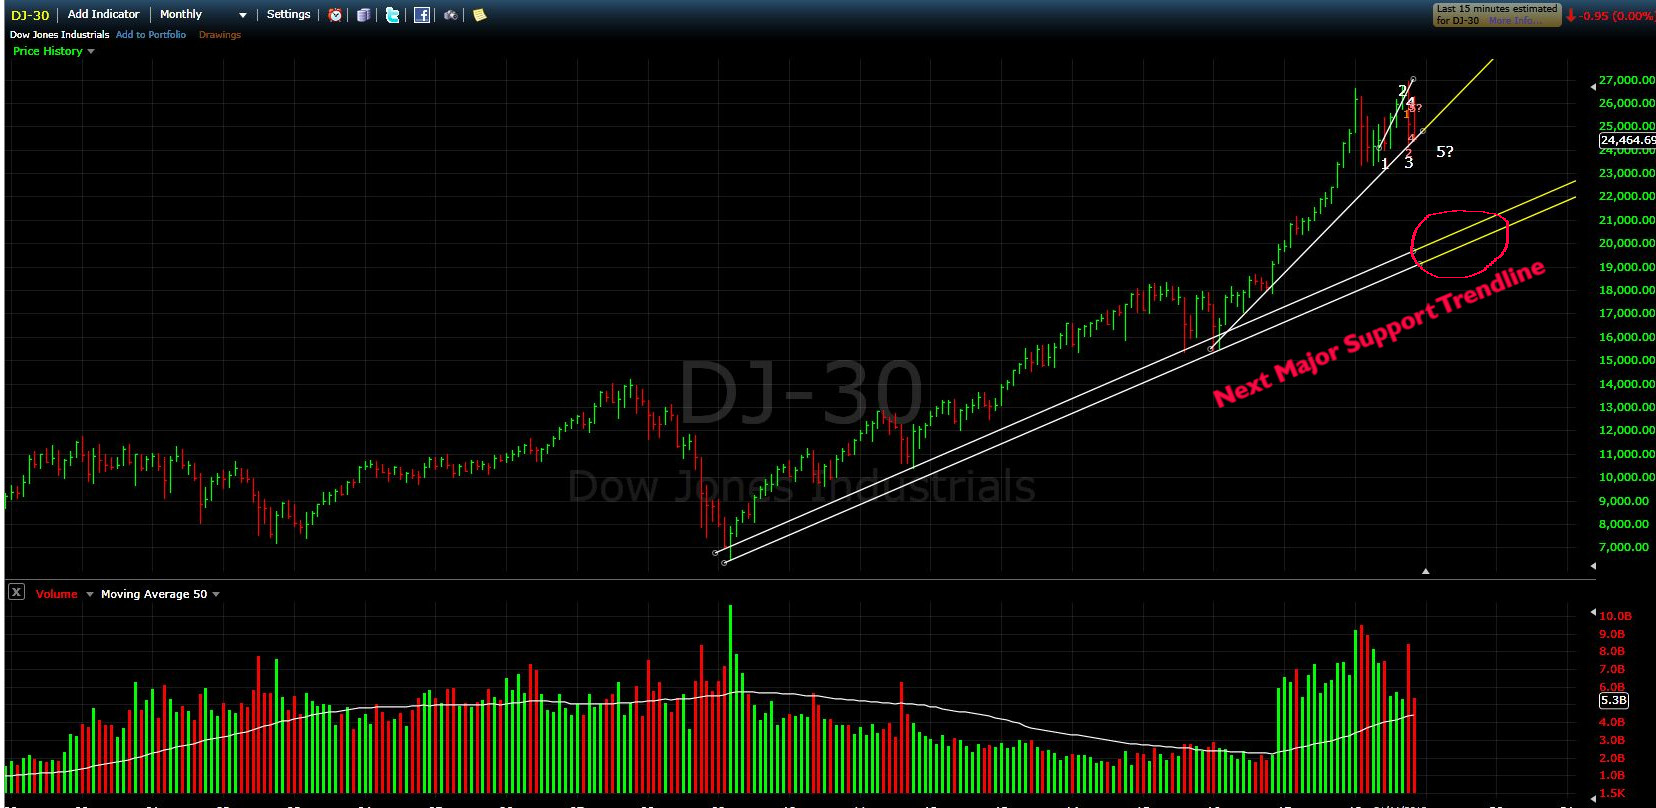
With all the negativity in the markets right now, and the news saying that we are heading towards a major market crash. It will be interesting to see if this really is a Wolfe Wave and price take off to the upside again, or if the price will blow through the entry point and carry on down to the next trend-line support on the monthly chart below.

Only time will tell what happens next. Anything could turn the market back up, including an agreement with China over trade, or lifting sanctions on some other countries, or maybe things calming down with Russia. Who knows? I like to watch this stuff just for fun. I enjoy looking at the technical aspects of the markets, which have an uncanny way of predicting the future. As well as the fundamental aspects to try and learn what events actually drive the markets.
Updates on my Growth and Peer to Peer Portfolios will come at the beginning of December.
None of the information in this post should be construed as investment advice. Please read my Disclaimer before making investment decisions.
.


