Overview
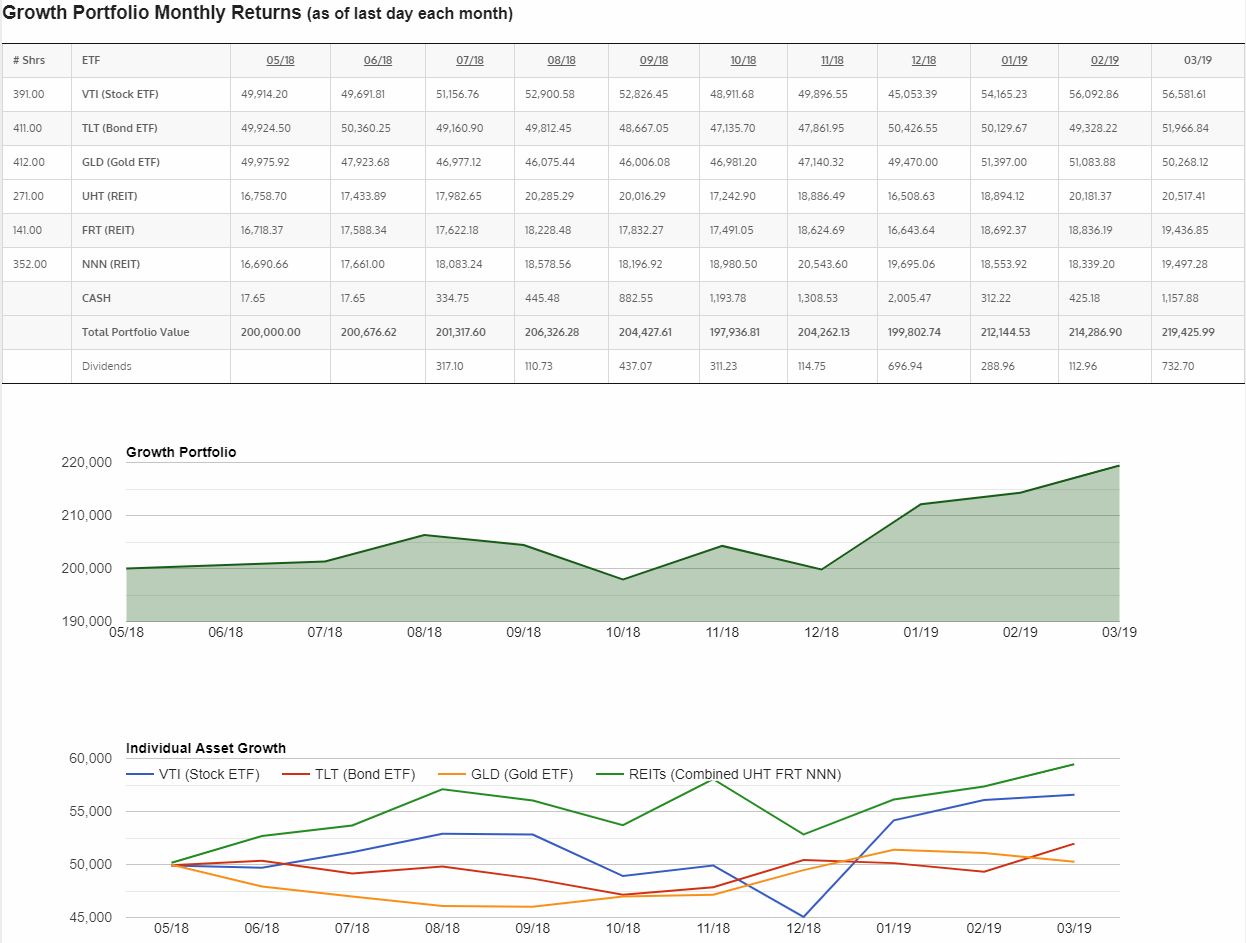
If anyone has any doubts about how well a carefully constructed portfolio of mixed assets can work, this should help to alleviate them. As of the end of March, the Growth Portfolio is up almost 10% just since the beginning of 2019!
You can see by the Individual Asset Growth chart that the gold and bond ETF’s started up in December after the stock market panic pullback, and then all asset classes except gold continued up into March. Gold was down just a small amount in March which is expected as it’s meant to be kind of a contrary non-correlated asset. The stock market ETF (VTI) came back huge again, and the REITs look like they’re heading to the moon. For me this portfolio is still the best asset allocation & portfolio out there. I just haven’t come across anything that consistently returns the same numbers without the big drawdowns.
Dividends
Dividends for March 2019 are as follows:
VTI – 301.85
TLT – 104.10
UHT – 182.93
FRT – 143.82
TOTAL $732.70
Backtesting
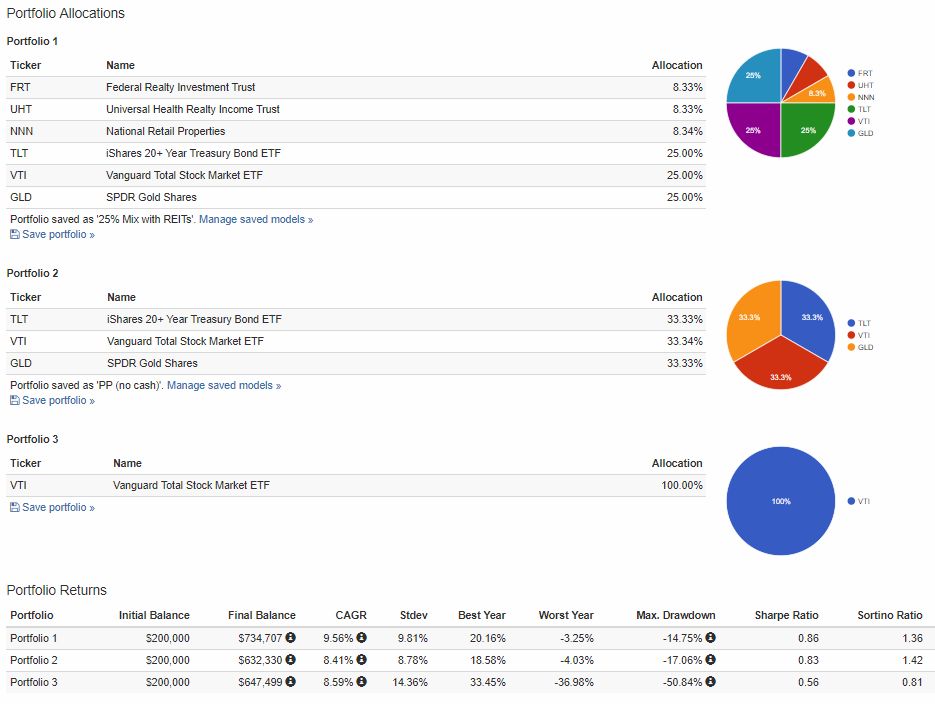
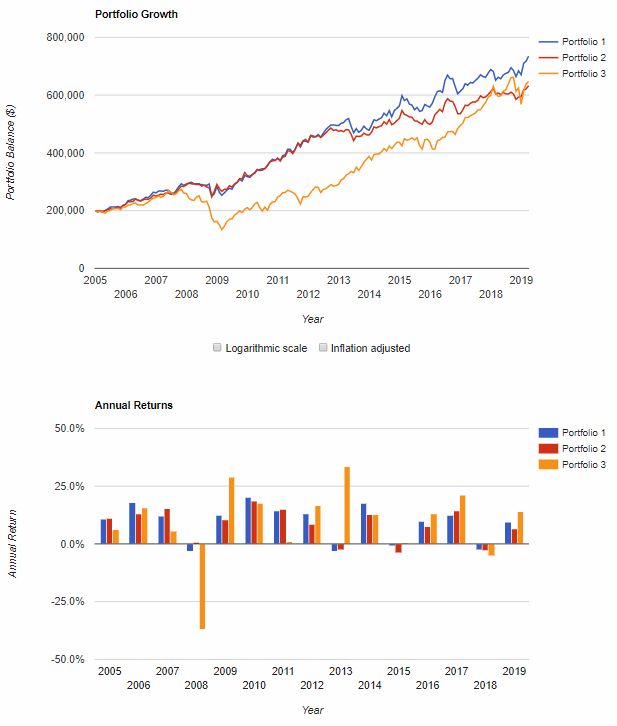
I decided to update the backtest of our portfolio (Portfolio 1 below) again for March 2019. Comparing it to other popular portfolios, we can see that we still perform very well over time. You can see that VTI (total US stock market representation, Portfolio 3 below) overtook the Permanent Portfolio (Portfolio 2 below) for overall growth in 2019, however it spent almost 10 years below it after the 2008 crash. The stock market (VTI) still didn’t overtake my personal Growth Portfolio though 🙂
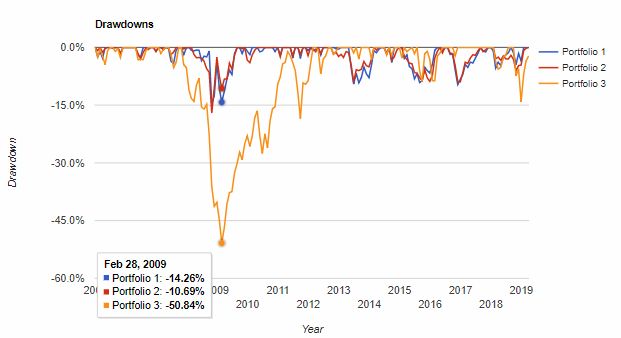
Even with the Permanent Portfolio, personally I could give up a little bit of potential gains for the peace of mind of low drawdowns. Take a look at the drawdown section below (bottom graphic) in February of 2009, the orange line (just stocks). Could you deal with over 50% of your savings disappearing in a few weeks? It looks easy when you look at a historical backtest and see how it comes roaring back. You think, “no problem, I’m a tough cookie, I can handle that”. However when you’re actually in the middle of that dip, feeling the pain, it’s a whole different ballgame. Many people sell out at that time and try to preserve capital, just to see the market come roaring back after they have locked in that 50%+ loss.
The personal Growth Portfolio would have drawn down only 14.26% according to this test, which is much easier to stomach. Now, if you really can’t deal with drawdown, then go with Harry Browne’s Permanent Portfolio (Portfolio 2 below) as that had only a 10.69% drawdown in the same period (17.06% in 2008).
Still, if you look at overall performance, my personal portfolio beats them all with a CAGR (Compound Annual Growth Return) of 9.56% for the past 14 years. $200,000 invested 14 years ago would be worth almost $735,000 today! All you had to do was re-balance one time per year.
Summary
Just a short update this month as the portfolio and the numbers really speak for themselves. I’ve decided moving forward I’ll keep the Growth Portfolio numbers up-to-date at the end of each month, but I won’t write a full update post unless there is something meaningful to transmit.
I wish you all a prosperous April! Good luck in your investing, wherever you choose to park your capital.
Please read my Disclaimer before making investment decisions. The above information is provided for informational purposes only and should not be construed in any way as financial advice.



IS there any way to get into USA Investments such as yours from UK?
Most brokers will let you purchase USA securities but you’ll need to purchase them in US dollars. For the best deals though, you can use US brokers who have a UK presence (there are quite a few if you Google it). Your unused cash is protected here up to $250k by the US FDIC (Government backed insurance).
A similar portfolio can be constructed using GB pounds. I made a few suggestions here about half way down